
Differences in visual perception are correlated with variation in sea-finding behaviour between hatchling leatherback, Dermochelys coriacea, and loggerhead, Caretta caretta, marine turtles
Samantha E. Trail Samantha E. Trail, Michael Salmon Samantha E. Trail
Department of Biological Sciences, Florida Atlantic University, Boca Raton, FL, U.S.A
Department of Biological Sciences, Florida Atlantic University, Boca Raton, FL, U.S.A
ARTICLE INFO
Article history:
Received 22 September 2021
Initial acceptance 25 October 2021
Final acceptance 8 December 2021
MS. number: A21-00555R
Received 22 September 2021
Initial acceptance 25 October 2021
Final acceptance 8 December 2021
MS. number: A21-00555R
Keywords:
Dermochelys
evolution
leatherback
light intensity discrimination
orientation
perception
sea finding
vision
Dermochelys
evolution
leatherback
light intensity discrimination
orientation
perception
sea finding
vision
After completing embryonic development, marine turtle hatchlings emerge from their subsurface nest, generally at night, and crawl to the ocean (‘sea finding’). That response depends upon the ability of the turtles to discriminate between the brighter seaward versus a dimmer landward horizon, followed by a positive phototaxis. While the crawls of most marine turtle hatchlings are well oriented and straight, those of leatherback hatchlings are sometimes interrupted by bouts of circling. We conducted experiments comparing the orientation and crawling behaviour of leatherbacks to those of loggerhead hatchlings to determine why those differences occur. The two species did not differ in the light spectra attracting the hatchlings, but leatherback thresholds for detection and for intensity discrimination were significantly higher than those of loggerheads. At the nesting beach, loggerheads under full (bright) or new (darker) moon conditions crawled straight to the ocean; circling rarely occurred. Leatherback crawls under a full moon were indistinguishable from those of loggerheads, but during new moon trials, when horizon brightness differences approached leatherback intensity discrimination thresholds, circling increased significantly. We conclude that circling is probably used by leatherbacks to reinforce orientation decisions when horizon cues become more difficult to discern. Circling could be costly as it lengthens the crawl and increases exposure to terrestrial predators. We hypothesize that those costs persist because other visual adaptations affecting sensitivity enhance the ability of leatherbacks to detect prey, mates or favourable habitats in an open ocean environment.
© 2022 The Association for the Study of Animal Behaviour. Published by Elsevier Ltd. All rights reserved.
© 2022 The Association for the Study of Animal Behaviour. Published by Elsevier Ltd. All rights reserved.
Marine turtles are large, long-lived reptiles characterized by high fecundity, high juvenile mortality and low adult mortality, with life histories dominated by extensive migrations between habitats most favourable for survival during different phases of their ontogeny (Hendrickson, 1980). As such, they have been attractive subjects for studies to determine how they complete impressive feats of orientation and navigation over long distances in what to humans is a featureless ocean (Lohmann & Lohmann, 2019). That migratory lifestyle is initiated when a clutch of precocial hatchlings emerges from a subsurface nest, generally at night on an oceanic beach, and then performs an oriented crawl from the nest to the ocean − an innate behaviour known as ‘sea finding’ (Mrosovsky & Kingsmill, 1985). Sea-finding orientation is based upon visual cues detected through a perceptual filter to sequentially scan a horizontally wide
∗ Corresponding author. E-mail address: salmonmichael07@gmail.com (M. Salmon).
https://doi.org/10.1016/j.anbehav.2022.02.009
0003-3472/© 2022 The Association for the Study of Animal Behaviour.
Published by Elsevier Ltd. All rights reserved.
0003-3472/© 2022 The Association for the Study of Animal Behaviour.
Published by Elsevier Ltd. All rights reserved.
(180°) by vertically narrow (30°) view of the horizon (Lohmann et al., 1997). The hatchlings then crawl toward the centre of the horizon that reflects the most radiance − light from a single direction. That light is provided by celestial sources (stars and the moon) and in most instances it is the seaward view, as the dune and its vegetation in a landward direction absorb light while light is reflected from the water surface in the seaward direction (Lohmann et al., 1997). That difference in radiance between opposing horizons enables hatchlings to locate the ocean even when the uneven surface of the beach precludes a direct view of the sea, at least for a small hatchling (Limpus, 1971; Mrosovsky & Shettleworth, 1968; Salmon et al., 1992). While the cues used by marine turtle hatchlings to locate the sea from the nest have been intensively studied and known for years, differences in performance between species are also well documented but have been largely ignored even though they might provide useful information for understanding both the proximate and ultimate factors shaping the phototaxis response. Leatherback hatchlings, Dermochelys coriacea, for example, often interrupt their
S. E. Trail, M. Salmon / Animal Behaviour 187 (2022) 47e54
crawls by making small, quickly executed circles (Carr & Ogren, 1959) whereas the crawls of other species (loggerheads, Caretta caretta, and green turtles, Chelonia mydas, have been extensively studied) are characteristically straight, leading directly to the ocean (Fig. 1). Those differences persist even though the same underlying mechanism (a phototropotaxis) is believed to be used by all species to determine direction (Mrosovsky & Kingsmill, 1985). Leatherback hatchling crawling speeds on land are slower than those of loggerheads and green turtles (Wyneken, 1997); circling should not occur as it further lengthens the time hatchlings require to reach the sea, increasing the duration of their exposure to terrestrial predators (Erb & Wyneken, 2019). Why, then, is circling observed, and why most commonly only in leatherbacks? A single attempt to answer these questions (Mrosovsky & Shettleworth, 1975) concluded that circling in leatherbacks plays no role in determining direction and that ‘quantitative differences’ (none clearly specified) are likely responsible for eliciting circling behaviour. In this study, we present evidence that leatherback hatchlings differ from loggerhead and green turtle hatchlings in perceptual sensitivity to the visual cues used in sea finding. We also document that under field conditions, a behavioural correlation exists: leatherback circling increases on the darkest evenings when radiance values and differences are lowest, suggesting sensitivity differences can affect performance. To reach these conclusions, we posed the following three questions. (1) Are leatherback hatchlings attracted to the same light wavelengths, and with the same sensitivity, as loggerhead hatchlings? (2) Is the ability of leatherbacks to discriminate between differences in radiance (such as those required to distinguish between landward and seaward horizons) comparable to that ability in loggerheads? Finally, (3) if differences occur, can they be related to other adaptations shaping how leatherbacks versus loggerheads use vision to meet their ecological needs?
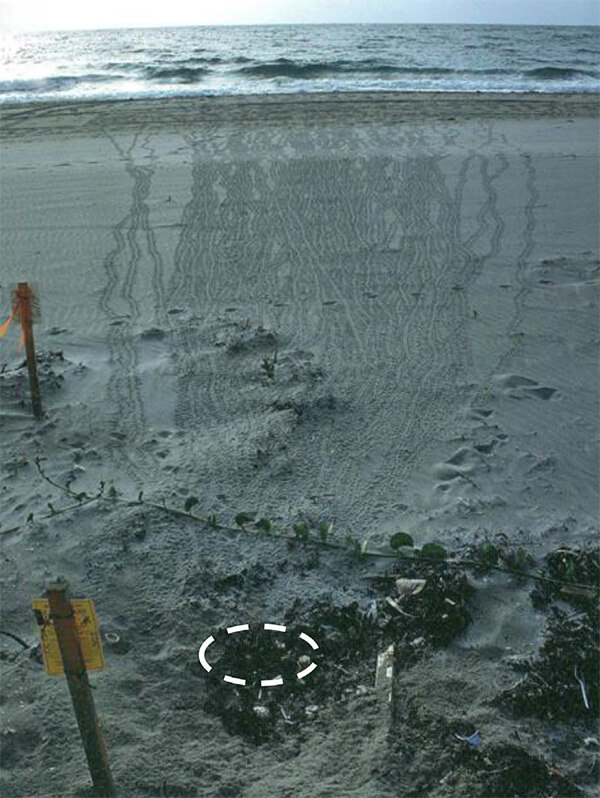
Figure 1. Tracks in the sand made by crawling loggerhead hatchlings that emerged from
a nest (located within the dashed circle) at Boca Raton, Florida, U.S.A.
the previous evening. Photo: Kirsten Jones
a nest (located within the dashed circle) at Boca Raton, Florida, U.S.A.
the previous evening. Photo: Kirsten Jones
METHODS
Study Sites and Hatchling Acquisition
We obtained leatherback and loggerhead hatchings from nests monitored between May and September 2020 and 2021, at two nesting beaches in southeastern Florida, U.S.A.: Juno Beach (26° 52ʹ48ʹʹN, 80° 3ʹ0ʹʹW) and Boca Raton (26° 21ʹ44ʹʹN, 80° 4ʹ8ʹʹW). Hatchlings were collected from the nest in the late afternoon of the evening that they would naturally emerge. They were then held in a light-tight (but not air-tight) Styrofoam container with a shallow layer of damp beach sand. They were either (1) transported by car from the beach to a windowless laboratory on the campus of Florida Atlantic University, where they were used for experiments, or (2) released at the nesting beach a few hours later (after the onset of darkness) to study their behaviour while crawling to the sea. Each hatchling was used in either one laboratory or one field trial, then released at the beach to begin its offshore migration.
Wavelength Perceptual Thresholds
Perceptual thresholds were obtained by presenting each hatchling with a near-monochromatic light wavelength, projected as a circular target 6 cm in diameter at the end of one arm of a black Plexiglas Y-maze (Fig. 2). The other arm of the Y-maze was kept dark. If that stimulus was detected, it elicited a positive phototaxis favouring entry into the illuminated arm whereas if the stimulus was below threshold, hatchlings were equally likely to crawl into either arm. That difference in distribution was used to determine the turtles' perceptual threshold at each wavelength. A detailed description of those methods, including controls, is presented in Celano et al. (2018) for loggerhead and green turtle hatchlings. Here, we provide an abbreviated summary of those same methodologies used in this study to determine thresholds from leatherback hatchlings.
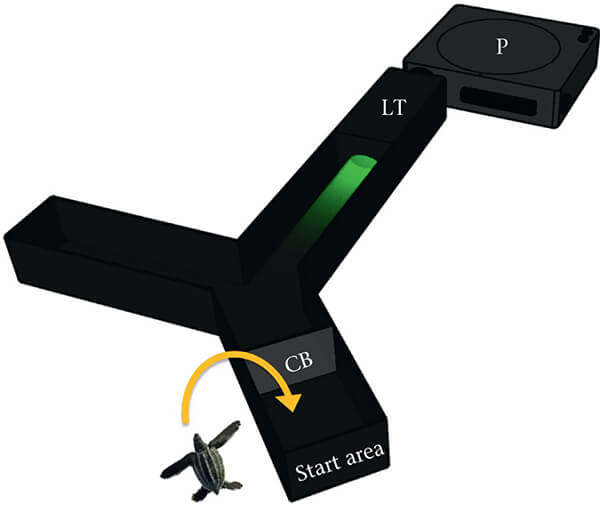
Figure 2.The Plexiglas Y-maze used in this study. A projector (P) presented a light stimulus at the end of one Y-maze arm; the other arm remained dark. That light was then filtered by interference and neutral density filters housed in the light tunnel (LT). A clear barrier (CB) confined the hatchling to a start area until the stimulus was presented. Once the barrier was raised, the hatchling could initiate a crawl and choose to enter one of the two arms (modified from Celano et al., 2018)
S. E. Trail, M. Salmon / Animal Behaviour 187 (2022) 47-54
We determined hatchling thresholds by presenting light stimuli between 340 and 600 nm at 20 nm increments, beginning with a stimulus bright enough to attract most (if not all) of the turtles into the illuminated arm. Subsequent trials with the same wavelength were repeated with additional groups of naïve hatchlings after reducing the stimulus radiance in 0.3−0.5 log steps with the use of neutral density filters. Once the hatchlings no longer showed a preference for the illuminated arm, trials were repeated with new subjects after increasing the stimulus radiance in 0.3 log unit steps until the preference for the illuminated arm was re-established (the ‘up−down staircase method’ of Dixon & Mood, 1948; see also Cornsweet, 1962). No hatchlings were used for more than one stimulus presentation. We defined the threshold at each wavelength as the lowest radiance (in photons per cm² /s) that evoked a statistically significant preference for the illuminated arm (as determined by a one-tailed binomial test at P ⋜ 0.05; Zar, 1999).
We used Kodak slide projectors (Model 440) with 300 W tungsten halogen lamps to present stimuli between 400 and 600 nm. Near-UV light wavelengths at 340, 360 and 380 nm were presented using a Great Value 14 W incandescent ‘blacklight’ bulb (Model EDXO-14), placed inside a foil-lined, 20-litre Styrofoam box containing a 6 cm diameter circular hole in one wall that was placed against the end of the Y-maze arm.
Interference filters (Edmund Scientific Optics, Blackwood, NJ, U.S.A.; 5 nm half bandwidth, 25 mm diameter) were used to modify all the light sources so that the desired wavelength was produced. We used a hand-held spectrometer (SRI 2000, Allied Scientific Pro, Gatineau, Quebec, Canada) to confirm that each stimulus was within ± 3 nm of its designated wavelength.
The intensity of each presented wavelength was measured in watts using a UDT S471 Optometer (San Diego, CA, U.S.A.), calibrated for use with a UDT 247 sensor for nearly equivalent sensitivity to wavelengths between 340 and 600 nm. Values were then converted into photons per cm² /s using the formula:

where 1 W = 1 J/s; h = Plank's constant (6.626 × 10⁻³⁴ J/s); c = speed of light (2.998×10⁸m/s) and λ = wavelength (in nm) (Celano et al., 2018).
Paired Radiance Thresholds
Sea-finding orientation is based upon the ability of hatchlings to discriminate between radiance differences (the dimmer landward versus the brighter seaward horizon; Lohmann et al., 1997). We simulated those conditions by presenting leatherback and loggerhead hatchlings, tested in the Y-maze, with paired and contrasting light intensity cues. Testing was done using two wavelengths detected with elevated sensitivity by both species: 400 and 500 nm (see below). Thresholds were defined as the smallest difference in intensity that elicited a statistically significant preference for the more brightly illuminated arm. Experiments began by exposing hatchlings to the same light wavelength simultaneously projected from both arms at double the intensity of its previously determined perceptual threshold. That outcome was a distribution of arm entries that was statistically indistinguishable from 50:50. Subsequent groups of turtles were then tested after the intensity of the stimulus projected from one arm, randomly selected, was increased in small (0.3 log) unit steps until a significant preference for that stimulus was established (as determined by a one-tailed binomial test).
The intensity of the brighter stimulus was then reduced in 0.15 log unit steps until that preference was extinguished, at which point it was once again increased to re-establish and confirm the preference (the ‘upedown staircase’ method; see above). Up to 18 hatchlings were tested at each intensity pairing to obtain a statistically informative distribution of arm entries
Crawling Paths, Circling and Orientation Accuracy
These observations were made at the Juno Beach site to compare differences in crawling performance between the species under two conditions of nocturnal illumination: new or full moon. The procedures used were as follows. Up to 10 hatchlings were removed from the nest of each species, either in the late afternoon or at dusk, and then briefly stored in a covered Styrofoam cooler containing moist beach sand until the onset of darkness. Turtles of both species were then released, one hatchling at a time, at the location of a single leatherback nest site so that differences between species in their crawling behaviour could not be attributed to differences in the distance or direction of that nest relative to the surf zone. Release evenings were dictated by the availability of emerging hatchlings. Testing was confined to full moon evenings ± 2 days and to new moon evenings or those after dark, before moonrise. Full moon trials were done under clear skies or widely scattered cloud cover. The moon was always visible at an azimuth equal to or exceeding 30 above the horizon.
Each hatchling's crawling behaviour was observed for up 20 min, or until it reached the high tide line (whichever came first). As each hatchling crawled, the distance it moved was marked along the track at 1 min intervals, as was its frequency of circling. An orientation angle for each crawl was calculated by determining the vector between the nest site and the location where the hatchling reached the high tide line.
Vectors for all of the hatchlings released under each phase of lunar illumination were analysed using Rayleigh tests (Zar, 1999) to determine a group (second-order) mean angle, an r vector (measure of scatter) and a probability that the distribution represented a nonrandom (statistically significant) pattern of orientation. WatsoneWilliams tests (Zar, 1999) were used to determine whether orientation performance differed between the conspecific groups tested under new or full moon conditions, and between species. Fisher's exact tests (Siegel & Castellan, 1988) were used to compare frequencies of circling under new moon and full moon conditions within and between species. One-tailed ManneWhitney U tests (Siegel & Castellan, 1988) were used to compare crawl duration between species under new moon and full moon conditions.
RESULTS
Wavelength Thresholds
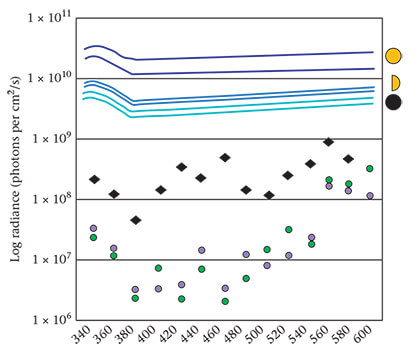
Leatherback hatchling thresholds (in photons per cm2 /s) varied between 6.31 × 10⁷ at 380 nm and 9.67 × 10⁸at 560 nm (Table 1). Turtles were most sensitive to the near-ultraviolet (UV) wavelengths at 360 and 380 nm, and to the visible wavelengths between 480 and 500 nm (Fig. 3, Table 1). Leatherbacks were consistently less sensitive by as much as 2 log units to all wavelengths than either green turtle or loggerhead hatchlings. However, leatherback thresholds to all wavelengths ⋜ 580 nm remained below background light levels at Juno Beach, even under the dimmest (new moon) conditions (Fig. 3).
S. E. Trail, M. Salmon / Animal Behaviour 187 (2022) 47-54
Table 1
Perceptual thresholds of leatherback hatchlings to near-monochromatic light wavelengths between 340 and 580 nm
Perceptual thresholds of leatherback hatchlings to near-monochromatic light wavelengths between 340 and 580 nm
Wavelength (nm)
Threshold (photons per cm² /s)
Distribution (+/−)
Total no. of nests
No. of hatchlings tested
340
2.36 × 10⁸
7/1
3
54
360
1.25 × 10⁸
7/1
2
47
380
6.31 × 10⁸
6/0
2
71
400
1.41 × 10⁸
9/2
2
30
420
6.39 × 10⁸
6/0
7
104
440
3.79 × 10⁸
7/1
2
45
460
7.60 × 10⁸
6/0
5
99
480
1.67 × 10⁸
10/3
3
44
500
1.11 × 10⁸
9/2
2
61
520
4.66 × 10⁸
10/3
3
59
540
6.42 × 10⁸
6/0
2
36
560
9.67 × 10⁸
7/1
6
113
580
6.86 × 10⁸
10/3
3
49
Each threshold was the lowest intensity of that wavelength that attracted a statistically significant number of hatchlings into the illuminated arm (as determined by a onetailed binomial test). The outcome of each threshold determination is shown by the distribution of arm entries (þ for the illuminated arm, for the dark arm). Data were obtained from 812 turtles found in a total of 42 nests.
Wavelength (nm)
Figure 3. Log radiance available for hatchling sea finding at night, paired with the perceptual thresholds determined for leatherback hatchlings (black diamonds, this study). Thresholds for green turtle (green filled circles) and loggerhead (purple filled circles) hatchlings were previously determined by Celano et al. (2018). Thresholds indicate the lowest radiance that attracted a statistically significant proportion of the hatchlings into the illuminated Y-maze arm. Data points lower in the graph represent greater (enhanced) sensitivity. The paired lines at the top of the graph show the background light spectra measured at Juno Beach, Florida, U.S.A., under full moon (dark blue), quarter moon (blue) and new moon (light blue) conditions. The top line of each pair corresponds to the brighter seaward horizon while the bottom line corresponds to the dimmer landward horizon.Paired Radiance Thresholds
Loggerhead discrimination thresholds at 400 and 500 nm were well below the radiance differences between the landward and seaward horizon, regardless of lunar phase (Table 2). The same was true for leatherback discrimination thresholds under full moon illumination and at 500 nm under new moon illumination (Table 2). However, at 400 nm under light levels during a new moon, leatherback discrimination thresholds exceeded those horizon radiance differences (Table 2).
Crawling Paths, Circling and Orientation Accuracy
Hatchling releases were conducted adjacent to seven different leatherback nests at Juno Beach. A total of 33 leatherback hatchlings from eight nests and 24 loggerhead hatchlings from five nests served as subjects for these observations.
Under a full moon, both leatherback and loggerhead hatchlings showed statistically significant (Rayleigh tests: P 0.05) and statistically identical (U2 = 0.064, P < 0.50) orientation in a seaward direction (Fig. 4). Under new moon conditions, loggerhead orientation accuracy was statistically identical to its performance under a full moon (U2 = 0.041, P < 0.50). That was also the case with leatherbacks although the vectors for individual turtles were more variable than those shown under a full moon. However, performance did not differ statistically from observations made under full moon illumination (U2 = 0.13, P < 0.20; Fig. 4). In loggerheads, differences in lunar phase had no statistical effect on the distribution of crawl durations or the frequency of circling (Fig. 4, Table 3). However, in leatherbacks, under new moon conditions, crawling durations (ManneWhitney U test: U = 46.0, P < 0.001) and circling (Fisher's exact test: P = 0.02) increased significantly compared to their frequencies under full moon illumination.
DISCUSSION
Perceptual Sensitivity Convergence among Species during Sea Finding
In this study we obtained phototaxis thresholds for leatherback hatchlings using the same techniques employed previously to determine those perceptual thresholds for loggerhead and green turtle hatchlings. All three species demonstrated an enhanced sensitivity to shorter light wavelengths during sea finding (360−500 nm; Fig. 3). Why this enhanced sensitivity persists during sea finding is not obvious especially since physiologically, all three species can detect much longer wavelengths (Crognale et al., 2008; Granda & O'Shea, 1972; Horch et al., 2008) and light at those longer frequencies is more abundantly available at night (Cronin et al., 2014).
One possibility is that ‘dark noise’, associated with the longer wavelengths, could make discriminating between horizon brightness differences more difficult. Dark noise is defined as the activation of biochemical pathways responsible for receptor response by means other than those produced by photons (Aho et al., 1988; Warrant, 1999). Its interference increases as a function of longer wavelengths and elevated body temperatures (Cronin et al., 2014). Under most circumstances, dark noise effects do not occur in reptiles as their body temperature, especially at night, is generally cool, but the digging activity of dozens of hatchlings associated with emergence from the nest can elevate their body temperatures to values between 25° and 28° C (Mrosovsky, 1968). Under those conditions, being most sensitive to the shorter light wavelengths may provide advantages.
S. E. Trail, M. Salmon / Animal Behaviour 187 (2022) 47-54
Table 2
Dune and seaward radiance differences and intensity discrimination thresholds of leatherback and loggerhead hatchlings at two (400 and 500 nm) wavelengths
Dune and seaward radiance differences and intensity discrimination thresholds of leatherback and loggerhead hatchlings at two (400 and 500 nm) wavelengths
Wavelength (nm)
Radiance difference
(photons per cm2 /s)a
(photons per cm2 /s)a
Intensity discriminationb
Full Moon
New Moon
Species
Threshold
(photons per cm2 /s)
(photons per cm2 /s)
Distribution (+/−)
No. of hatchlings tested
400
8.40 × 10⁹
5.80 × 10⁸
Leatherback
9.26 × 10⁸
7/1
55
500
9.30 × 10⁹
6.20 × 10⁸
Loggerhead
2.42 × 10⁸
7/1
36
Leatherback
5.11 × 10⁸
12/4
60
Loggerhead
2.87 × 10⁸
7/1
74
a Radiance differences between the dune and seaward view, based upon light levels measured at a nesting site (Juno Beach) in Florida. Values are based upon measurements presented in Celano et al. (2018).
b Thresholds measured in the laboratory based upon a value twice the radiance of the threshold at that wavelength (see Table 1). Each intensity discrimination threshold was the smallest difference at that wavelength that attracted a statistically significant number of hatchlings into the more brightly illuminated arm (as determined by a onetailed binomial test). The outcome for each threshold is shown by the distribution of arm entries (+ for the brighter illuminated arm, − for the dimmer illuminated arm).
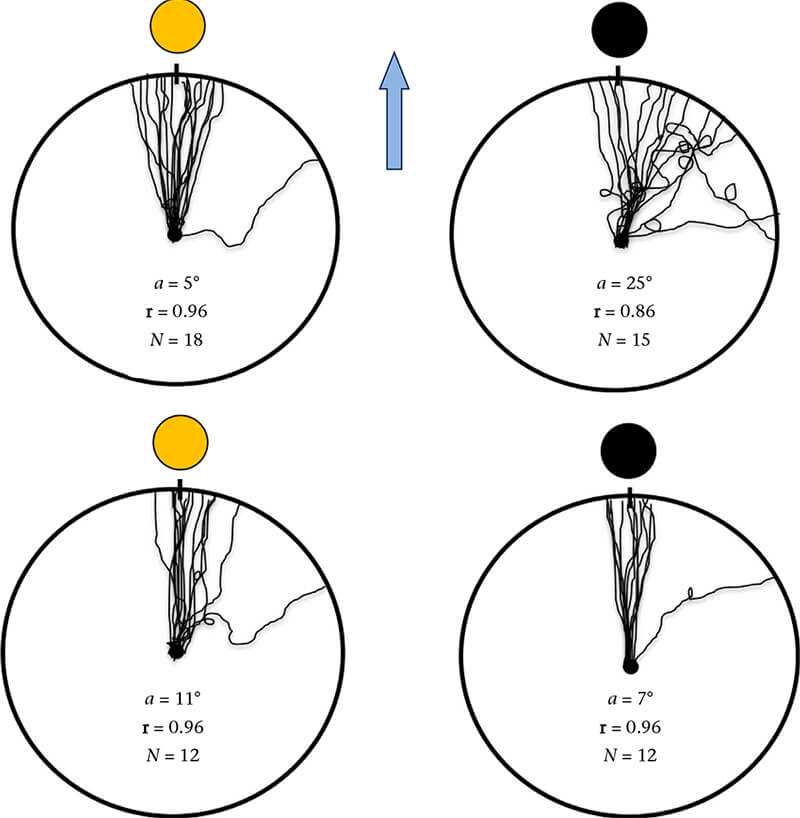
Figure 4. Crawling paths for hatchlings released at Juno Beach, Florida, U.S.A. under full (left circles) and new moon (right circles) illumination. Top row, leatherback hatchlings; bottom row, loggerhead hatchlings. a = group mean orientation angle; r = r vector, a measure of the angular variation within each distribution; N = the number of subjects. Note that some hatchlings show straight paths while others show occasional circles, and that leatherback circling increases under new moon conditions (see Table 3). Blue arrow indicates the most direct path to the sea. In all experiments, the hatchlings were significantly oriented (Rayleigh test: P ⋜ 0.05). See the text and Table 3 for additional details.
S. E. Trail, M. Salmon / Animal Behaviour 187 (2022) 47-54
Table 3
Comparisons between the performance of leatherback and loggerhead hatchlings during their crawls to the ocean from the nest site under full and new moon illumination
Comparisons between the performance of leatherback and loggerhead hatchlings during their crawls to the ocean from the nest site under full and new moon illumination
Species a,b
Lunar phase
Sample size
Circle crawls
Straight crawls
Median duration (min)
Within species comparisons
Leatherbacks
Full
18
2
16
3.65
U = 46
New
15
8
7
7.75
P < 0.001
Loggerheads
Full
12
4
8
4.00
U = 49
New
11
1
11
3.06
P = 0.10
Data include the sample size (number of hatchlings tested), the number of those turtles that crawled on straight versus circular paths and the median crawl duration of each species. Statistical comparisons are made using a 2 × 2 Fisher's exact test for straight versus circular paths and a Manne−Whitney U test (one-tailed) to compare crawl durations within and between the species. See the text for additional information.
a Under full moon illumination, there were no statistical differences between the species in the proportion of circling versus straight crawls. Under new moon illumination, leatherback circling increased significantly (Fisher's exact test: P = 0.02).
b Under full moon illumination, there were no statistical differences between the species in crawl duration. Under new moon illumination, leatherback crawls were significantly longer than those of loggerheads (Manne−Whitney U test: U = 22.5, P < 0.01)
Light Perception, Background Illumination and Circling Behaviour We found that leatherback hatchlings were 10−100 times less sensitive than loggerhead or green turtle hatchlings to those shorter wavelengths (Fig. 3). That result came as a surprise as leatherbacks, both as juveniles (Wyneken & Salmon, 1992) and as adults (Hays et al., 2004), forage during the day and at night whereas green turtles (Ogden et al., 1983) and loggerheads (Iverson et al., 2019) are primarily day-active foragers. However, leatherback eyes also fail to show any obvious structural adaptations that might promote improved visual function under dim lighting conditions, such as a proportionally larger cornea or lens to increase lightgathering potential, an increase in the ratio of rods to cones, or a tapetum to enhance photon detection (Fritsches & Warrant, 2013).
Given our perceptual threshold results, it seemed plausible to speculate that the more frequent circling behaviour by leatherback hatchlings might be related to differences in perceptual sensitivity. That hypothesis prompted us to pair our laboratory studies on perceptual sensitivity and intensity discrimination thresholds with a field study at the nesting beach comparing the crawling paths of both species under different conditions of background (lunar cycle) illumination.
On the basis of our results (Fig. 4, Table 3), we came to the following conclusions. First, circling was not exclusively performed by leatherbacks; it occurred in both species, although far less often in loggerheads. Second, circling was performed by some, but not by all, leatherback hatchlings as was also observed by Mrosovsky and Shettleworth (1975). Third, the frequency of circling was positively associated with low levels of background illumination, but only in leatherbacks. In loggerheads, circling frequencies remained low regardless of lunar phase (Fig. 4, Table 3). We hypothesized that (1) the ability of leatherbacks to discern the cues used in orientation is somehow compromised when background levels of illumination decline, (2) the frequency of circling is related to this effect and (3) the relative insensitivity of leatherbacks to light cues used in seafinding orientation is consistent with, and might account for, both phenomena (Fig. 3).
The differences between the species in their ability to discriminate between paired radiance cues provide further support for this hypothesis. Our data show that loggerhead thresholds were low enough to enable those hatchlings to detect the radiance extremes between landward versus seaward radiance horizons, regardless of the differences in background illumination associated with the lunar cycle (Table 2). So, also, were leatherback thresholds under a full moon. But during a new moon, those thresholds in leatherbacks permitted sea finding at 500 nm but not at 400 nm (Table 2). Thus, the ability of a leatherback hatchling to determine a seaward crawl direction could be accomplished under relatively high levels of lunar illumination using the full complement of light wavelengths at their disposal. However, when background levels were low, those cues became limited to a subset of the wavelengths that induce a sea-finding response.
That may be why their orientation vectors under new moon illumination were more scattered (Fig. 4, top right), why they were associated with a significant increase in circling behaviour (Table 3) and why circling was limited to some (but not all) of the hatchlings (probably attributable to differences among siblings in spectral sensitivity). This approach and its conclusions about circling differ from those of Mrosovsky and Shettleworth (1975). They sought to determine why circling occurred by observing how often it occurred when hatchlings were unilateral blindfolded, during different phases of the day−night cycle, and as a function of changes in illumination associated with weather conditions. At that time, no information on spectral sensitivity for this species was known. They rejected the conclusion we propose here, because the behaviour shown by the turtles after blindfolding suggested that cue sampling was synchronous rather than successive and that it consisted of a bilaterally symmetrical (phototropotaxis) process.
There are two reasons why those results might not have been representative of how sea finding is accomplished by leatherbacks. First, much of their data were derived from crawls observed in the morning or afternoon. But, leatherback hatchlings most often emerge from their nests in the early evening (1800−2100 hours, Eckert & Eckert, 1985; 1700−1900 hours, Gonzales & Stewart, 2019) and so it would have been preferable to limit trials and observations to that time period. Second, the hatchlings they used were sometimes those that had recently emerged and would have crawled to the sea that evening, but in other observations, they were subjects that had been kept captive for as long as 3 days. While they noticed no obvious effect of delayed testing, they made no attempt to quantitatively compare the behaviour of the turtles tested at different times postemergence to verify that the data were comparable.
It was nevertheless interesting that circling during the day increased under overcast and/or rainy conditions. Marine turtle visual acuity in air is poor (Bartol & Musick, 2002), and for that reason, hatchlings determine a seaward orientation based upon cues present over large (180° wide) horizontal areas (Fritsches & Warrant, 2013; Lohmann et al., 1997). Rain and overcast skies may have reduced levels of background illumination to the point where the turtles’ ability to detect brightness differences, even over large spatial areas, was impaired.
Why Are Leatherbacks Less Sensitive to Radiance Cues Than Loggerheads?
Finally, there remains the issue of why leatherback hatchlings are less sensitive to the radiance cues used in sea finding than their hard-shelled cheloniid (loggerhead and green turtle) relatives (Fig. 3). Given that the normal completion of a crawl from the nest to the sea is essential for establishing a new generation of marine turtles, we anticipated that selection should lead to functional convergence in sensitivity as well, especially since a similar array of light frequencies (this study) and physiological mechanisms (Mrosovsky & Kingsmill, 1985) apparently underpin how those cues are processed.
S. E. Trail, M. Salmon / Animal Behaviour 187 (2022) 47-54
But, leatherbacks differ profoundly from other marine turtle species in the physical features of the habitat they exploit, in their feeding specializations and in their foraging strategies. These features are well established as variables shaping the evolution of the many and varied visual adaptations displayed by other animals (Warrant & Johnsen, 2013). Below, we present evidence that those factors also apply to the evolved differences between the visual systems of leatherbacks and loggerheads and that differences in perceptual sensitivity represent the outcome of distinctly unique species-specific trade-offs between optical resolution and sensitivity (Cronin et al., 2014). The result serves to enhance visual function in each species, given its visual ecology.
After entering the sea, leatherback and loggerhead hatchlings swim offshore towards deep water, but their ultimate destinations differ. For leatherbacks, it is open water, where large, slow-moving jellyfish, salps and other ‘gelatinous zooplankton’ differing in shape and colour are plentiful, and upon which they specialize as predators (Bjorndal, 1997; Jones & Seminoff, 2013). Because the gelatinous prey of leatherbacks is nutritionally poor, leatherbacks at all stages of development must forage both during the day and at night; adults have been estimated to consume 20e30% of their body mass in prey each day, just to meet their daily energy requirements (Jones & Seminoff, 2013).
Leatherbacks are also deep divers that pursue jellyfish prey at depths where downwelling light wavelengths are restricted to those that penetrate best in seawater (450e500 nm). Like many other deep-sea organisms (crustaceans, fishes, marine mammals), leatherbacks are especially sensitive to those wavelengths, even as hatchlings (Fig. 3). At foraging depths below 1000 m where no downwelling light penetrates (Eckert & Eckert, 1989), leatherbacks may orient towards the bioluminescent flashes of individual prey items (Davenport, 1988; Haddock & Case, 1999; Widder, 2010). Adult leatherbacks will also forage in shallow coastal waters to take advantage of episodic jellyfish blooms, but for the most part, feeding is concentrated at deep-water locations where productivity is enhanced by nutrient upwelling (Saba, 2013). The leatherback habitat is best defined by the occupancy of open oceanic waters, by searches for prey that are slow moving, often large and varying in shape and colour, distributed over a broad range of depths and conditions of illumination that include the deep sea where downwelling light is absent.
Loggerhead hatchlings, in contrast, migrate offshore to oceanic nursery areas where they take shelter and find food in surfacefloating patches of flotsam. In the North Atlantic, those patches consist primarily of algae of the genus Sargassum (Bolten, 2003). In those brightly illuminated habitats, the turtles find both cover and food consisting of a wide assemblage of small organisms such as sessile epiphytes (hydrozoans, barnacles, bryozoans), as well as jellyfishes, pelagic snails, fish eggs and drift carrion such as insects that accumulate nearby (Witherington, 2002; Witherington et al., 2012). All of these items are small, and some are often camouflaged or transparent, so they require sufficient visual acuity to be distinguished from an algal or underwater background. As older juveniles and adults, they usually abandon oceanic habitats (Bolten, 2003) and forage primarily during the day on a generally richer and more diverse supply of food available in coastal waters. Prey consist of planktonic organisms (jellyfish, ctenophores) located in the water column, and more commonly, benthic invertebrates such as bivalves, crabs, anemones, mantid and peneid shrimp, hard corals and gastropods, whose capture requires that their location can be distinguished from background (Bjorndal 1997; Jones & Seminoff, 2013).
Foraging depths are relatively shallow, usually ranging between 9 and 22 m (Lutcavage & Lutz, 1997). How, given these conditions, should visual function be optimized for each species? There are a variety of ways, described most recently in a thorough review by Cronin et al. (2014), but for these two marine turtle species, available lighting appears to be the dominant element. Leatherbacks, as feeding specialists, face strong selection pressures to successfully forage throughout the water column, including locations where visible lighting is dim or absent. Under dim lighting conditions, the answer is by delaying the speed with which larger groups of photoreceptors can be stimulated by a scarce concentration of photons (Cronin et al., 2014; Fritsches & Warrant, 2013). The result is a ‘slow eye’, as measured physiologically by its limited ability to respond to rapidly repeated (‘flickering’) light. Perceptually, slow eyes result in a brighter, but by necessity coarser, image through temporal summation and increased photon catch; both are achieved at a cost of lower sensitivity at the receptor level (Warrant & Johnsen, 2013). Leatherback and loggerhead eyes are slow (Crognale et al., 2008), but leatherback eyes (flicker threshold ~10 Hz) are about 33% slower than loggerhead eyes (flicker threshold ~15 Hz; Horch & Salmon, 2009). Those results are correlated with the differences in sensitivity we report here, and suggest that leatherbacks, unlike loggerheads, are better adapted to foraging at deeper, and therefore darker, depths (Eckert et al., 2012; Fritsches & Warrant, 2013). Conversely, loggerhead eyes are more sensitive and faster than those of leatherbacks, and should be superior in resolving power and therefore capable of providing more detailed information useful for detecting variation in prey size, colour, shape or movement. Those features should be especially useful when the predator is a generalist.
Conclusions: the Evolution of Hatchling Visual Perception
To summarize, leatherback and loggerhead hatchlings, when they emerge from their nest and crawl to the sea, are both most sensitive to the shorter wavelengths present under the conditions of dim lighting at night. That special sensitivity differs remarkably from the sensitivity profiles obtained from an array of light wavelengths measured physiologically as neural responses in the retina. Those observations serve as evidence that stimulus filtering may play a role in sea finding for both species.
But combined with these similarities between the two species are other characteristics that distinguish the phototaxis thresholds obtained from leatherbacks from those obtained from loggerheads. These include differences in overall sensitivity as well as differences in response to specific clusters of wavelengths, such as those shown by leatherbacks to wavelengths between 480 and 500 nm (Fig. 3). Those wavelengths are specifically beneficial later in development when the turtles become capable of deep diving to forage at depths where light is wavelength-restricted. Thus, a comparative study of visual perception between these species reveals not only the ways that perception paves the way for immediate survival, but also the ways that the challenges awaiting these animals as they grow to maturity are also programmed and anticipated during ontogenetic development.
Author Contributions
This study served as a Master's thesis for Ms. Samantha E. Trail. The project subject was suggested by her advisor (Michael Salmon). The observations, measurements and data analyses were done by Ms. Trail. The manuscript was written by Ms. Trail and edited by Michael Salmon, with assistance from the student's thesis committee (Drs Stephen Kajiura and Jeanette Wyneken).
S. E. Trail, M. Salmon / Animal Behaviour 187 (2022) 47-54
Acknowledgments
This study was completed by S. E. Trail in partial fulfillment of the requirements for a Master of Science degree in the Department of Biological Sciences, Florida Atlantic University (FAU). Ms. Trail thanks her committee members, Drs J. Wyneken and S. Kajiura for their invaluable feedback and guidance from the development of this project to its completion. We thank the research staff at Gumbo Limbo Nature Center of Boca Raton and Loggerhead Marinelife Center of Juno Beach, Florida, U.S.A., for their collaboration and support locating sea turtle nest sites. M. Royer, N. Tempel and C. Jasper fabricated and maintained various pieces of essential equipment used in this project. We thank D. Booth and an anonymous referee for comments that improved manuscript organization and clarity. Lastly, Ms. Trail thanks her lab mates, friends and family for their continued support and enthusiasm for this work. This project was supported by the Department of Biological Sciences at FAU and by the National Save the Sea Turtle Foundation of Fort Lauderdale, Florida, U.S.A. The research design was peer-reviewed and authorized by the State of Florida (FWC Permit no. MTP-19- 173A) and was approved by the FAU Institutional Animal Care Committee (Protocol no. A20-13).
References
Aho, A. C., Donner, K., Hyden, C., Larsen, L. O., & Reuter, T. (1988). Low retinal noise in animals with low body temperature allows high visual sensitivity. Nature, 334, 348−350.
Bartol, S., & Musick, J. (2002). Sensory biology of sea turtles. In P. L. Lutz, J. A. Musick, & J. Wyneken (Eds.), The biology of sea turtles (Vol. II, pp. 79−102). Boca Raton, FL: CRC Press.
Bjorndal, K. A. (1997). Foraging ecology and nutrition of sea turtles. In P. L. Lutz, & J. A. Musick (Eds.), The biology of sea turtles (pp. 199−231). Boca Raton, FL: CRC Press.
Bolten, A. B. (2003). Variation in sea turtle life history patterns: neritic vs. oceanic developmental stages. In P. L. Lutz, J. A. Musick, & J. Wyneken (Eds.), The biology of sea turtles (Vol. II, pp. 243−258). Boca Raton, FL: CRC Press.
Carr, A., & Ogren, L. (1959). The ecology and migrations of sea turtles. 3. Dermochelys in Costa Rica. American Museum Novitides, 1958, 1−29.
Celano, L., Sullivan, C., Field, A., & Salmon, M. (2018). Seafinding revisited: how hatchling marine turtles respond to natural lighting at a nesting beach. Journal of Comparative Physiology A: Neuroethology, Sensory, Neural and Behavioral Physiology, 204, 1007−1015.
Cornsweet, T. N. (1962). The staircase method in psychophysics. American Journal of Psychology, 75, 485−491.
Cragnole, M. A., Eckert, S. A., Levenson, D. H., & Harms, C. A. (2008). Leatherback sea turtle Dermochelys coriacea visual capacities and potential reduction of bycatch by pelagic longline fisheries. Endangered Species Research, 5, 249−256.
Cronin, T. W., Johnsen, S., Marshal, N. J., & Warrant, E. J. (2014). Visual ecology. Princeton University Press.
Davenport, J. (1988). Do diving leatherbacks pursue glowing jelly? British Herpetological Society Bulletin, 24, 20−21.
Dixon, W. J., & Mood, A. M. (1948). A method for obtaining and analyzing sensitivity data. Journal of the American Statistical Association, 43, 109−126.
Eckert, K. L., & Eckert, S. A. (1985). Tagging and nesting research of leatherback sea turtles (Dermochelys coriacea) on Sandy Point, St. Croix, U.S. Virgin Islands, 1985. Annual report to the Department of Interior, U.S. Fish and Wildlife Service, USFWS Ref. MIN 54S. Fish and Wildlifee D.C..
Eckert, S. A., & Eckert, K. L. (1989). Diving and foraging behaviour of leatherback sea turtles (Dermochelys coriacea). Canadian Journal of Zoology, 67, 2834−2840.
Eckert, K. L., Wallace, B. P., Frazier, J. G., Eckert, S. A., & Pritchard, P. C. H. (2012). Synopsis of the biological data on the leatherback sea turtle, Dermochelys coriacea [Biological Technical Publication BTP-R4015-2012]. Shepherdstown, WV: U.S. Fish & Wildlife Service.
Erb, V., & Wyneken, J. (2019). Nest-to-surf mortality of loggehead sea turtle (Caretta caretta) hatchlings on Florida's east coast. Frontiers in Marine Science, 6, 271.
https://doi.org/10.3389/fmars.2019.00271
Fritsches, K. A., & Warrant, E. J. (2013). Vision. In J. Wyneken, K. J. Lohmann, & J. A. Musick (Eds.), The biology of sea turtles (Vol III, pp. 32−53). Boca Raton, FL: CRC Press.
Gonzales, C. M., & Stewart, K. R. (2019). Emergence timing of leatherback hatchlings (Dermochelys coriacea) at Sandy Point National Wildlife Refuge, 2010−2014.
Chelonian Conservation and Biology, 18(2), 241−248. https://doi.org/10.2744/ CCB-1362.1 Granda, A. M., & O'Shea, P. J. (1972). Spectral sensitivity of the green turtle (Chelonia mydas mydas) determined by electrical responses to heterochromatic light. Brain, Behavior, and Evolution, 5, 143−154.
Haddock, S. H. D., & Case, H. F. (1999). Bioluminescence spectra of shallow and deep-sea gelatinous zooplankton: Ctenophores, medusae and siphonophores. Marine Biology, 133, 571−582.
Hays, G. C., Houghton, J. D. R., Isaacs, C., King, R. S., Lloyd, C., & Lovell, P. (2004). First records of oceanic dive profiles for leatherback turtles, Dermochelys coriacea, indicate behavioural plasticity associated with long-distance migration. Animal Behaviour, 67, 733−743.
Hendrickson, J. R. (1980). The ecological strategies of sea turtles. American Zoologist, 20, 597−608.
Horch, K. W., Gocke, J. P., Salmon, M., & Forward, R. B. (2008). Visual spectral sensitivity of hatchling loggerhead (Caretta caretta L.) and leatherback (Der- mochelys coriacea L.) sea turtles, as determined by single-flash electroretinog- raphy. Marine and Freshwater Behaviour and Physiology, 41, 79−91.
Horch, K., & Salmon, M. (2009). Frequency response characteristics of isolated retinas from hatchling leatherback (Dermochelys coriacea L.) and loggerhead (Caretta caretta L.) sea turtles. Journal of Neuroscience Methods, 178(2), 276−283.
Iverson, A. R., Fikosalo, I., Lamont, M. M., & Hart, K. M. (2019). Loggerhead sea turtle (Caretta caretta) diving changes with productivity, behavioral mode, and sea surface temperature. PLoS One, 14(8), Article e0220372. https://doi.org/10.1371/ journal.pone.0220372
Jones, T. T., & Seminoff, J. A. (2013). Feeding biology: Advances from field-based observations, physiological studies, and molecular techniques. In J. Wyneken, K. J. Lohmann, & J. A. Musick (Eds.), The biology of sea turtles (Vol. III, pp. 211−248). Boca Raton, FL: CRC Press.
Limpus, C. J. (1971). Sea turtle ocean finding behaviour. Search, 2, 385−387.
Lohmann, K. J., & Lohmann, C. M. F. (2019). There and back again: natal homing by magnetic navigation in sea turtles and salmon. Journal of Experimental Biology, 222, jeb184077. https://doi.org/10.1242/jeb.184077
Lohmann, K. J., Witherington, B. E., Lohmann, C. M. F., & Salmon, M. (1997). Orientation, navigation, and natal beach homing in sea turtles. In P. L. Lutz, & J. A. Musick (Eds.), The biology of sea turtles (pp. 107−135). Boca Raton, FL: CRC Press.
Lutcavage, M. E., & Lutz, P. L. (1997). Diving physiology. In P. L. Lutz, & J. A. Musick (Eds.), The biology of sea turtles (pp. 277−296). Boca Raton, FL: CRC Press. Mrosovsky, N. (1968). Nocturnal emergence by hatchling sea turtles: control by thermal inhibition of activity. Nature, 220, 1338−1339.
Mrosovsky, N., & Kingsmill, S. F. (1985). How turtles find the sea. Zeitschrift für Tierpsychologie, 67, 237−256.
Mrosovsky, N., & Shettleworth, S. J. (1968). Wavelength preferences and brightness cues in the water finding behaviour of sea turtles. Behaviour, 32, 211−257.
Mrosovsky, N., & Shettleworth, S. J. (1975). On the orientation circle of the leath- erback turtle, Dermochelys coriacea. Animal Behaviour, 23(3), 568−591.
Ogden, J. C., Robinson, L., Whilock, K., Daganhardt, H., & Cebula, R. (1983). Diel foraging patterns in juvenile green turtles (Chelonia mydas L) in St. Croix United States Virgin Islands. Journal of Experimental Marine Biology and Ecology, 66, 199−205.
Saba, V. S. (2013). Oceanic habits and habitats: Dermochelys coriacea. In J. Wyneken, K. J. Lohmann, & J. A. Musick (Eds.), The biology of sea turtles (Vol. III, pp. 163−188). Boca Raton, FL: CRC Press.
Salmon, M., Wyneken, J., Fritz, E., & Lucas, M. (1992). Seafinding by hatchling sea turtles: role of brightness, silhouette and beach slope as orientation cues. Behaviour, 122(1), 56−77.
Siegel, S., & Castellan, N. J. (1988). Nonparametric statistics for the behavioral sciences. New York: McGraw-Hill.
Warrant, E. J. (1999). Seeing better at night: Life style, eye design, and the optimum strategy of spatial and temporal summation. Vision Research, 39, 1611−1630.
Warrant, E. J., & Johnsen, S. (2013). Vision and the light environment. Current Biology, 18(23), R990−R994. https://doi.org/10.1016/j.cub.2013.10.019
Widder, E. A. (2010). Bioluminescence in the ocean: origins of biological, chemical, and ecological diversity. Science, 328(5979), 704−708.
Witherington, B. E. (2002). Ecology of neonate loggerhead turtles inhabiting lines of downwelling near a Gulf Stream front. Marine Biology, 140, 843−853.
Witherington, B. E., Hirama, S., & Hardy, R. (2012). Young sea turtles of the pelagic Sargassum-dominated drift community: habitat use, population density, and threats. Marine Ecology Progress Series, 463, 1−22.
Wyneken, J. (1997). Sea turtle locomotion: mechanics, behaviour, and energetics. In P. L. Lutz, & J. A. Musick (Eds.), The biology of sea turtles (pp. 165−198). Boca Raton, FL: CRC Press.
Wyneken, J., & Salmon, M. (1992). Frenzy and postfrenzy swimming activity in loggerhead, leatherback, and green sea turtles. Copeia, 1992(2), 478−484. Zar, J. H. (1999). Biostatistical analysis (4th ed.). Upper Saddle River, NJ: Prentice Hall.

Helping Sea Turtles Survive for 39 Years
A NON-PROFIT ORGANIZATION
State of Florida Registration Number CH-2841 | Internal Revenue Code 501 (c) (3)
Web Design & Development by Web Expressions, LLC